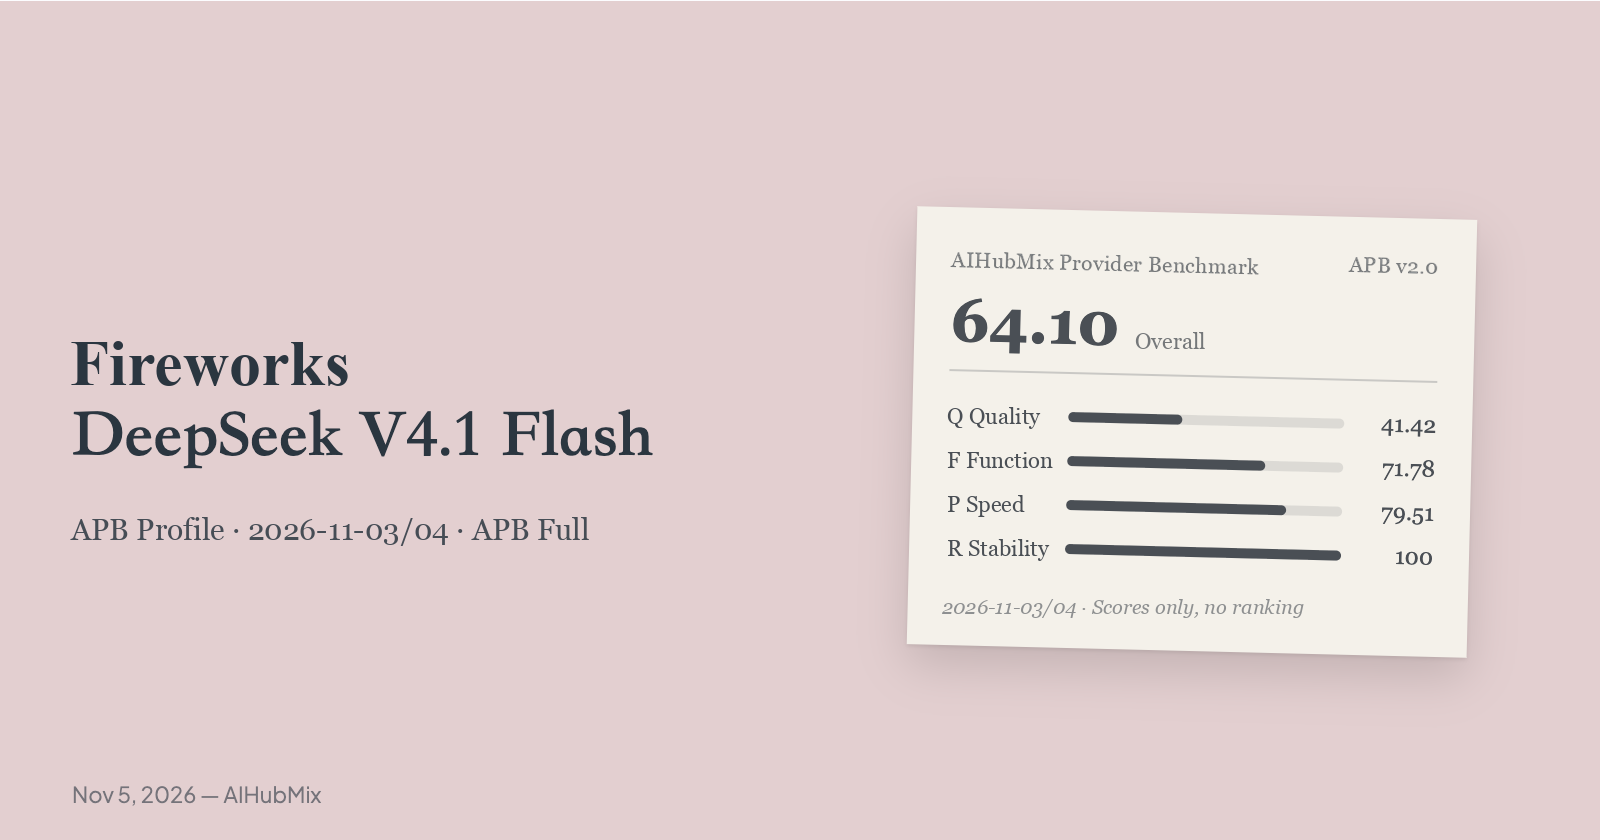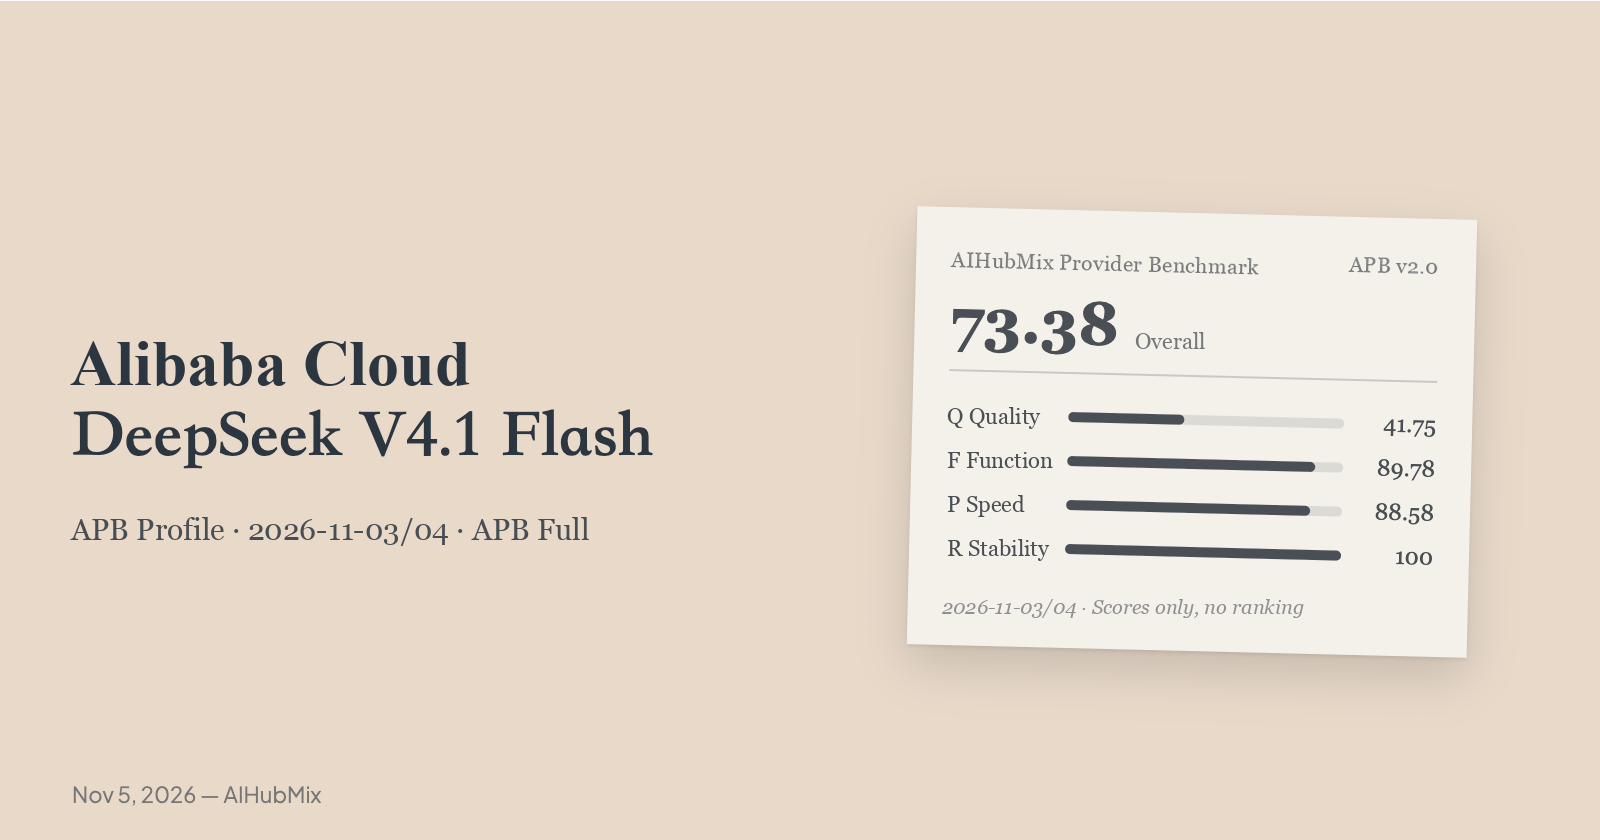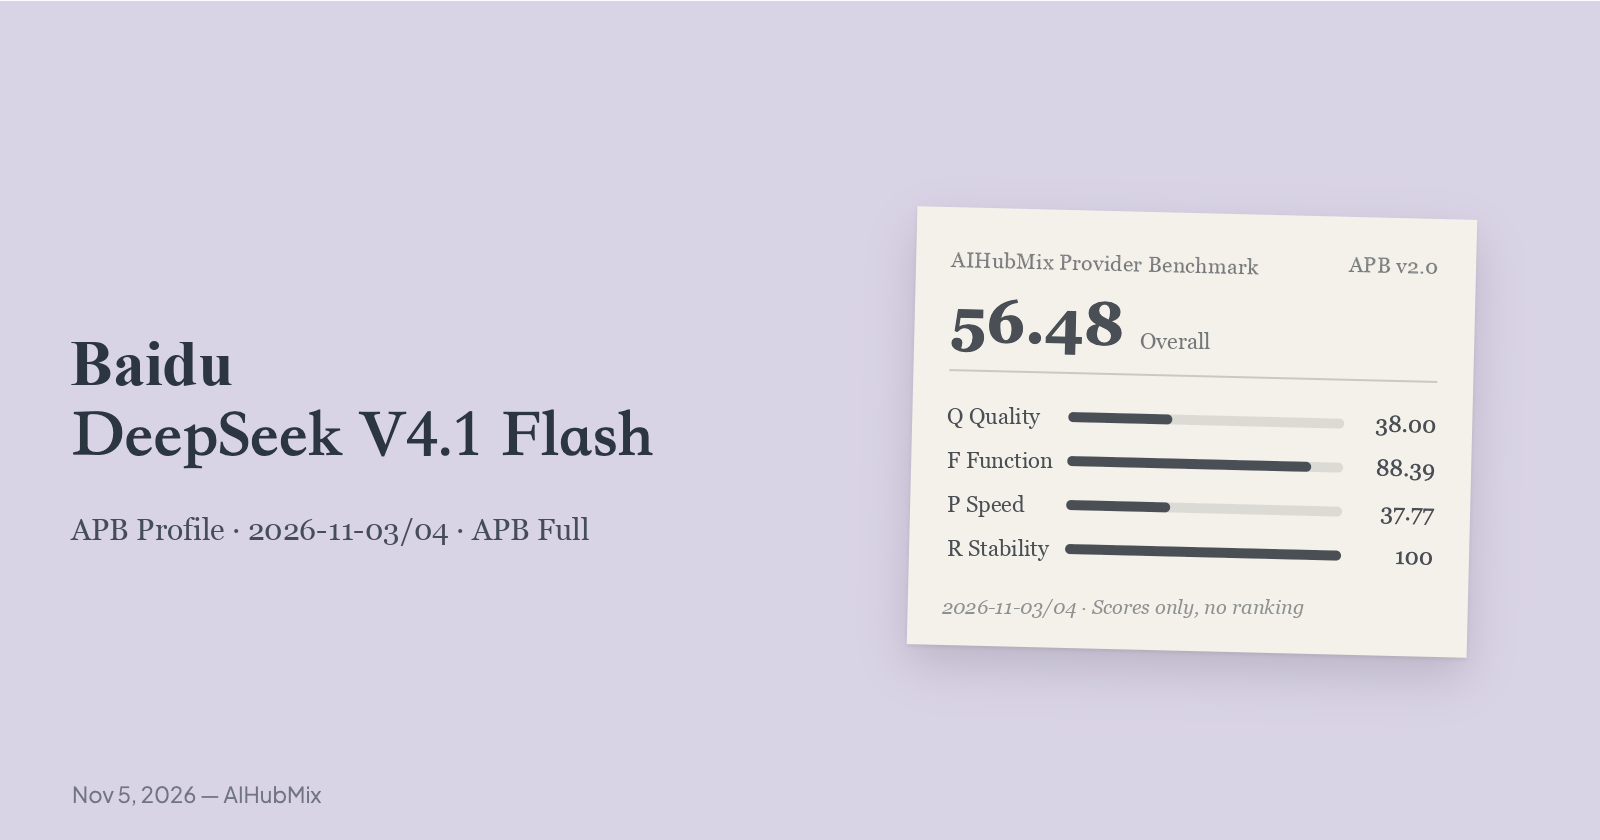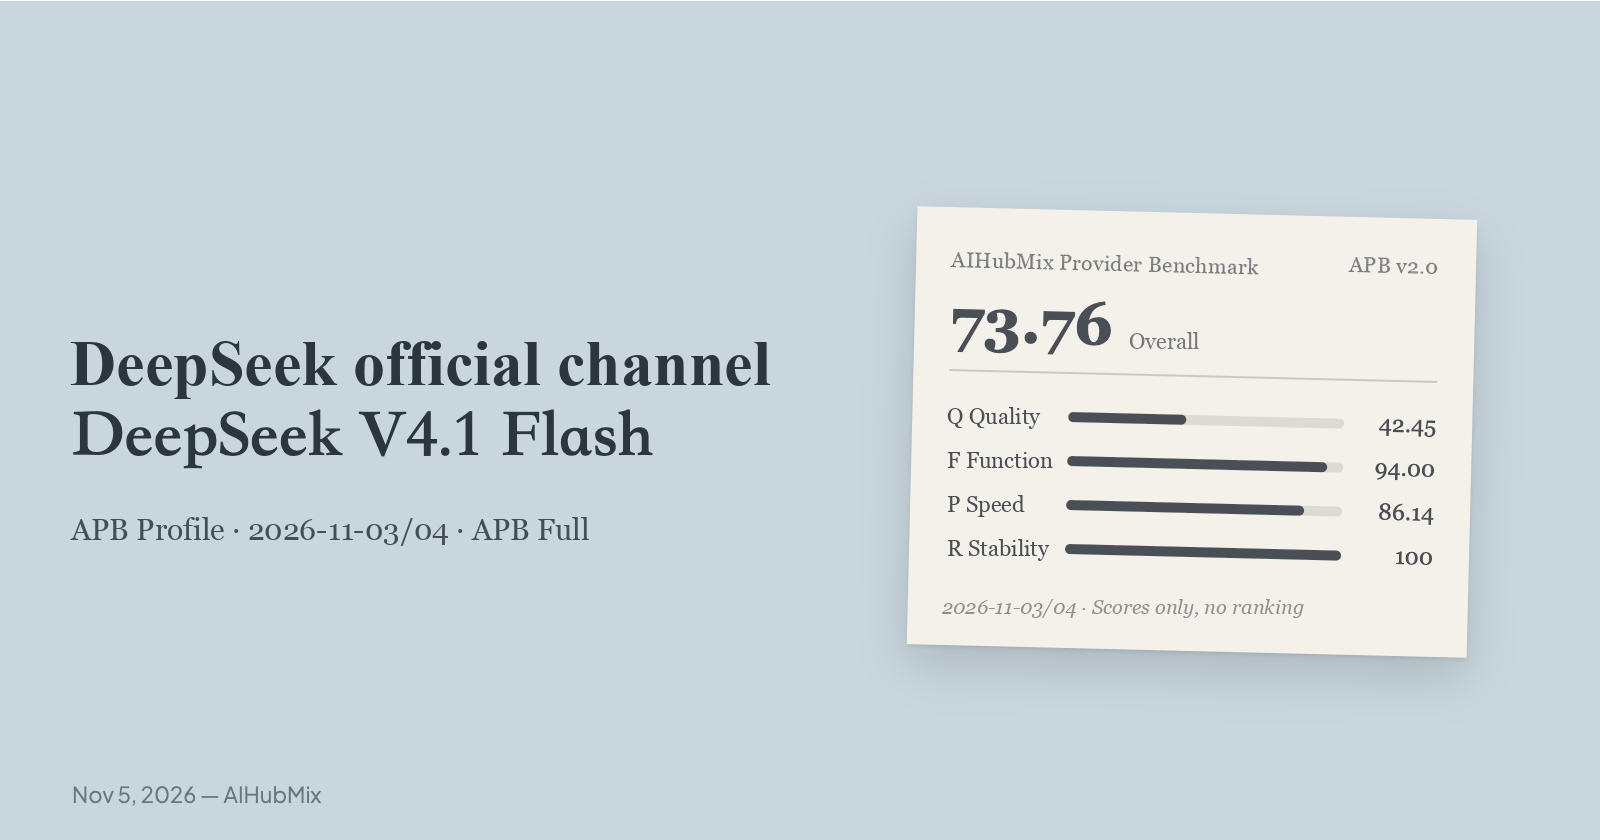
On 2026-11-03/04, the APB Full suite ran against DeepSeek V4.1 Flash 1017 on five providers through AIHubMix. The same questions, parameters and request scripts were used for every provider; the five provider entries are on the models page. This APB Profile covers the DeepSeek official channel only. It is reached through AIHubMix's DeepSeek official supplier route, not a direct connection to DeepSeek's API.
This post reports scores only, without ranking providers or recommending one: Q 42.45, F 94.00, P 86.14, K 98.38 and R 100. Q, F, P and R are the four section scores; K is a sub-score of P. The overall score, 73.76, is a summary index, not a certification, and has no confidence interval. The scoring standard is AIHubMix Provider Benchmark Standard v2.0.
Scores across five providers
Bold marks this post's provider. Fixed provider order, not a ranking. K is a sub-score of P at 20% and is listed separately for reference. The overall score is a summary index with no confidence interval. The DeepSeek official channel and Alibaba Cloud differ by 0.37 overall and are not distinguishable.
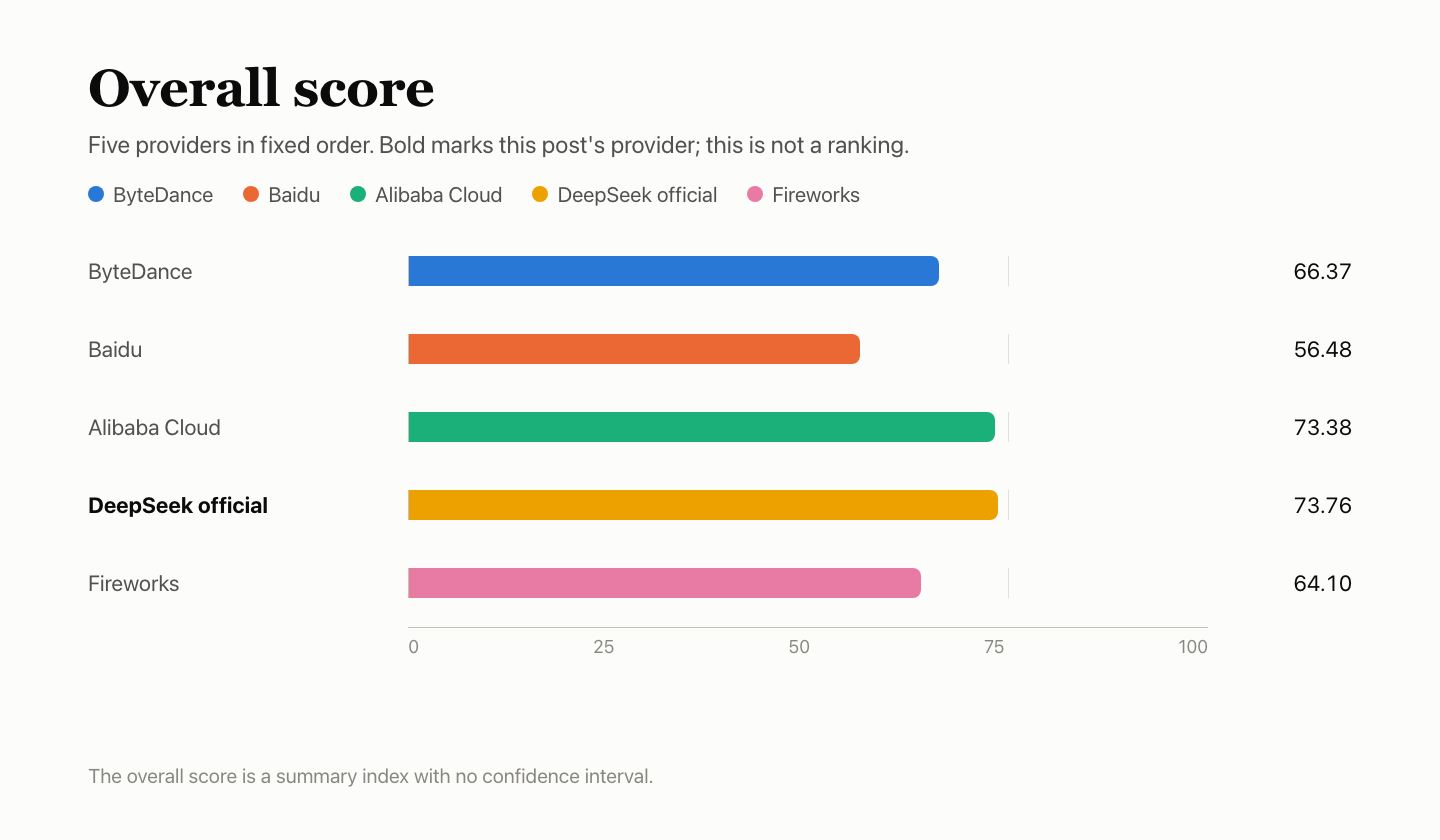
At a glance
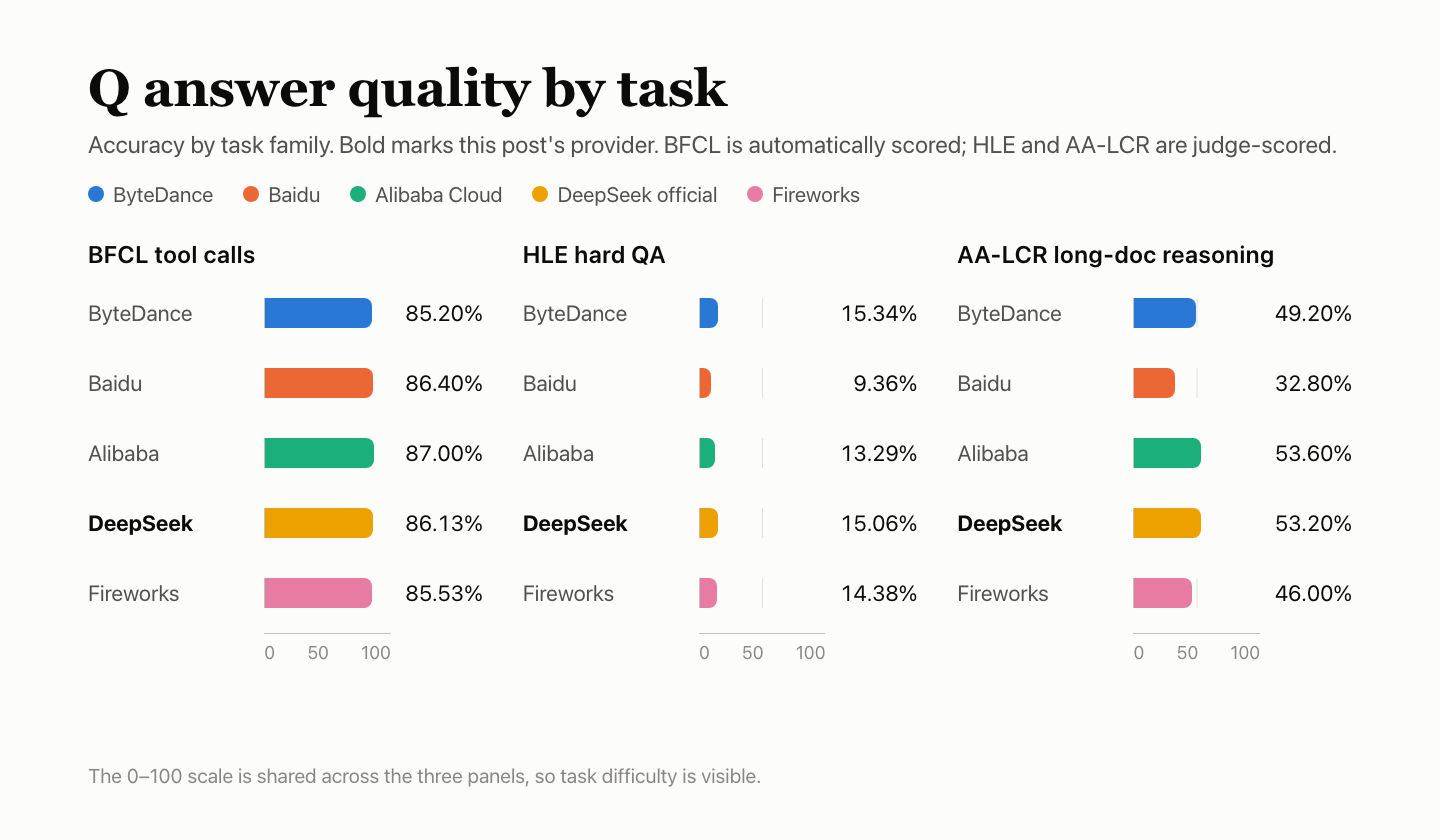
- Answer quality: Q 42.45. BFCL 86.13%, HLE 15.06%, AA-LCR 53.20%. Seven HLE outputs were truncated at the max_tokens limit and counted wrong. This channel is the Q baseline for the other four.
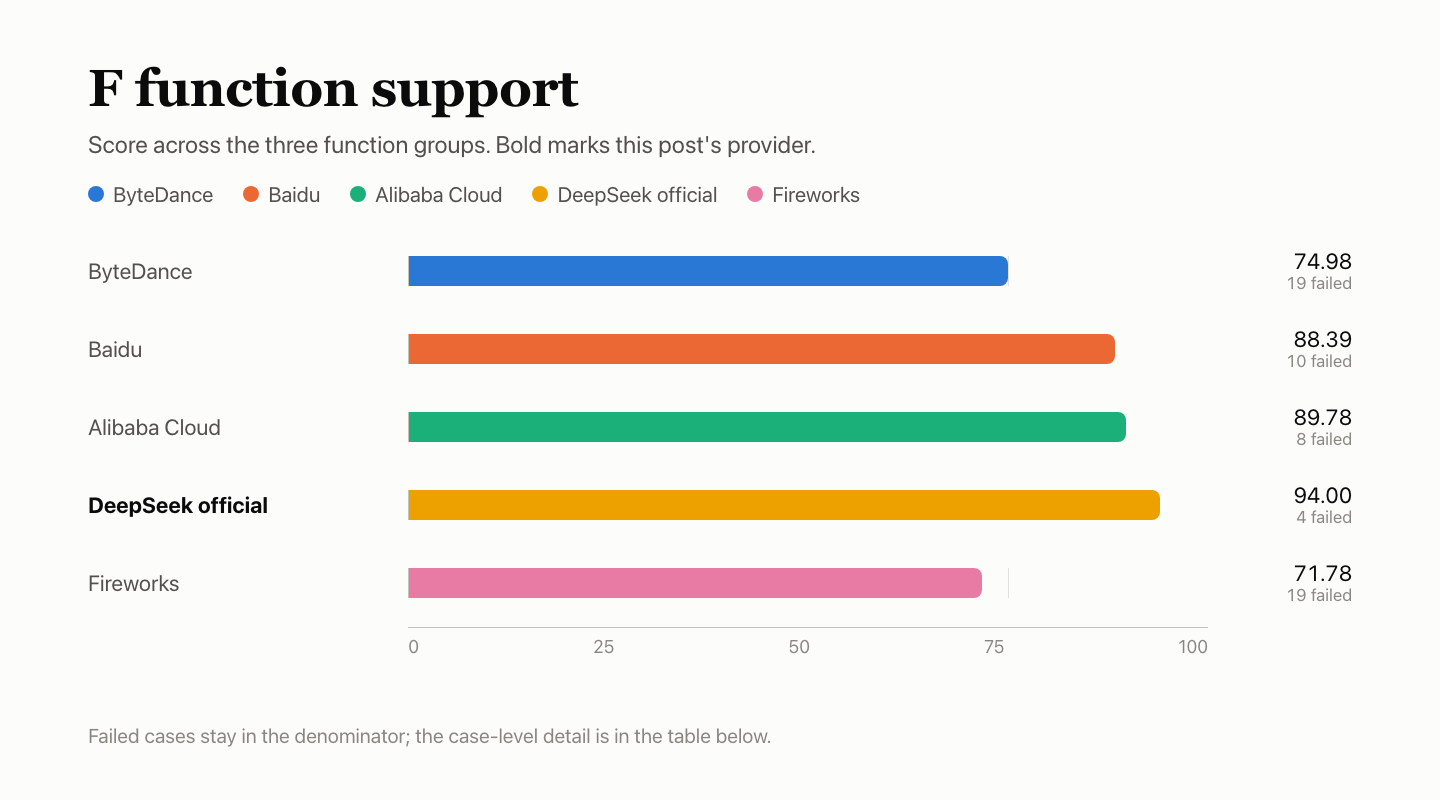
- Function support: F 94.00. 137 of 147 counted checks passed. A further 27 checks that depend on exact token counts were declared invalid and excluded from the denominator.
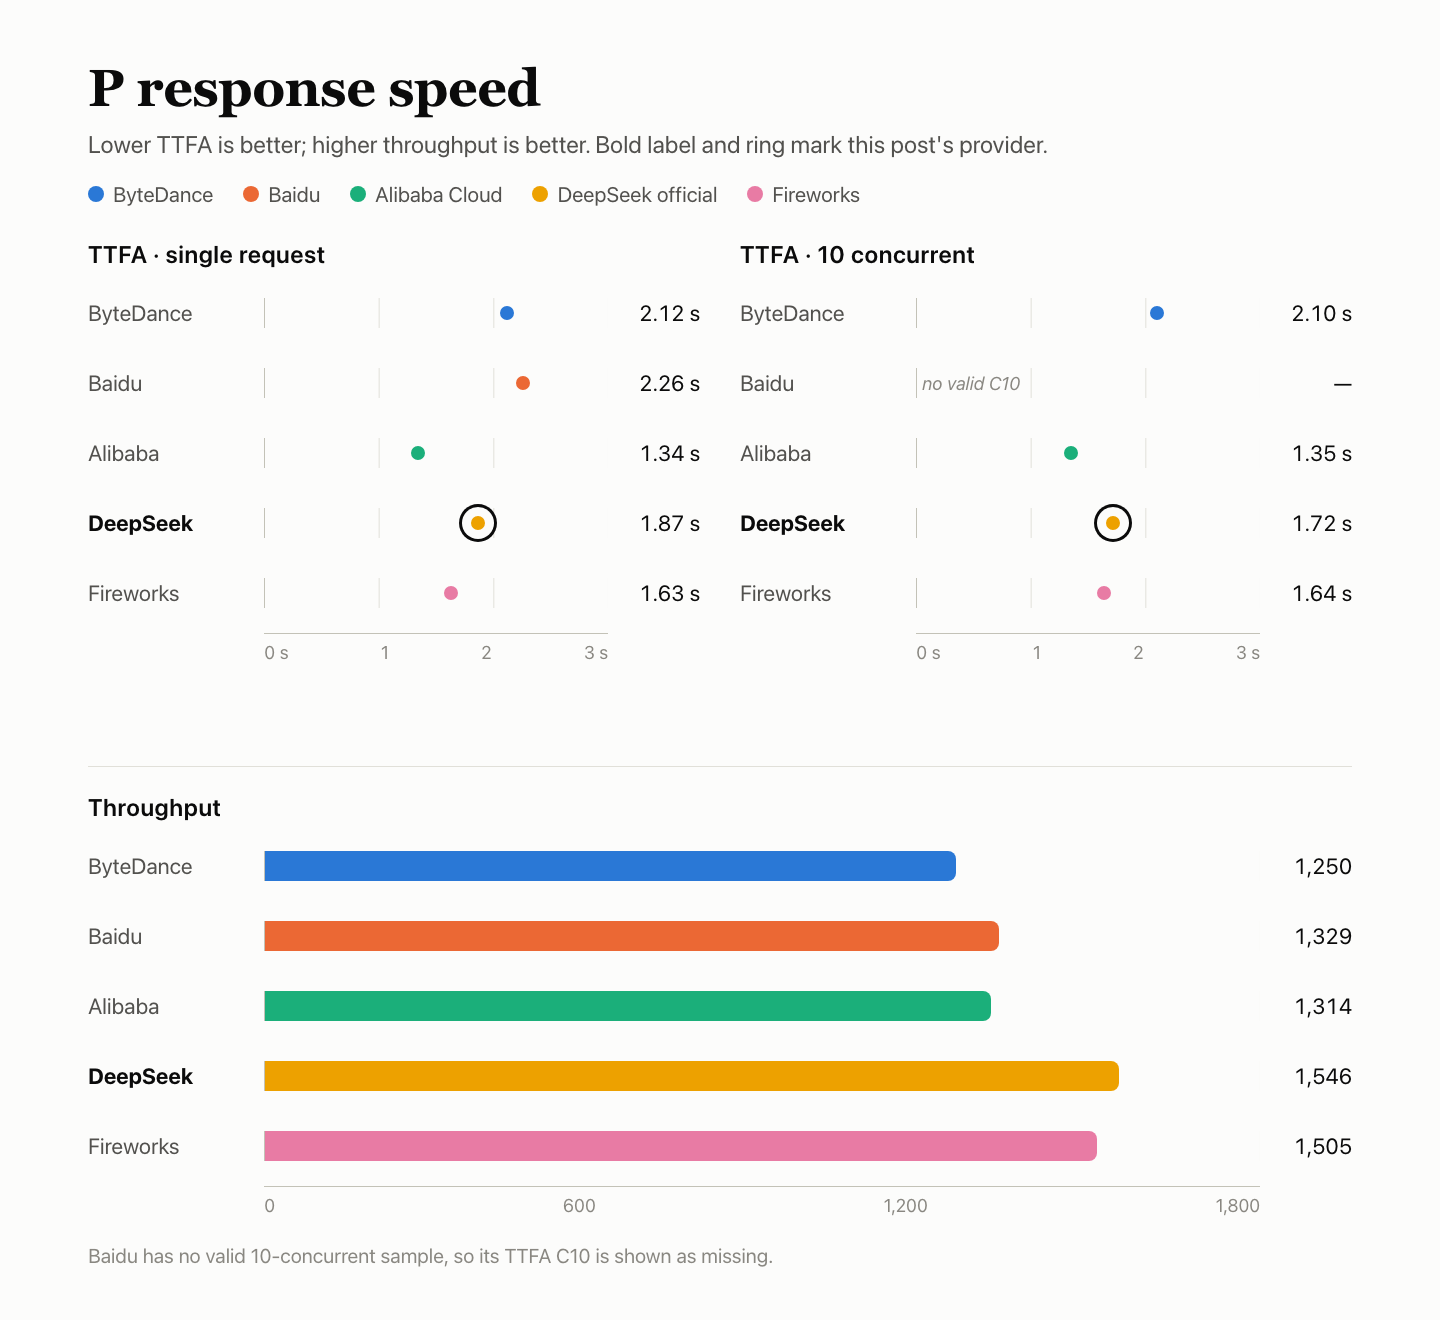
- Response speed: P 86.14. The first single-concurrency window had 15 invalid requests out of 30 (12 × 503, 2 × deadline, 1 × read timeout), counted at infinity; first-token median 1.87 s (valid-only 1.72 s); 10-concurrency 1.72 s; TPOT 2.84 ms.
- Cache: K 98.38. All 18 hot requests at 8k and 32k hit; cold controls read no cache.
- Service stability: R 100. 300 dedicated requests all succeeded on the first attempt.
Test setup
Requests went through AIHubMix by selecting the DeepSeek official supplier route; the quick start covers access configuration.
| Item | Detail |
|---|---|
| Model | DeepSeek V4.1 Flash 1017 |
| Requested model ID | deepseek-flash |
| Returned model name | deepseek-flash |
| Access route | AIHubMix DeepSeek official supplier route; not a direct connection to DeepSeek's API |
| Parameters | Non-thinking mode, temperature 1.0, max_tokens 16,384, timeout 300 s, no automatic retries |
| Thinking off | All requests used reasoning_effort=none |
| Time | 2026-11-03 18:07 – 11-04 16:33 UTC+8; five providers shared one Mac mini, network and account |
| Samples | Answer quality 4,250 attempts (BFCL 500 × 3, HLE 250 × 10, AA-LCR 25 × 10); function cases 60 × 3 windows; speed 90 single-concurrency and 90 at 10-concurrency; stability 300; cache 30 (three groups each at 8k and 32k prefixes) |
Q — answer quality: 42.45
The suite pools BFCL 500 questions × 3 runs, HLE 250 × 10 and AA-LCR 25 × 10. BFCL is graded by automatic rules; HLE and AA-LCR are graded by the judge model deepseek-flash. All five providers answered the same questions. Ten answers could not be graded and were removed, leaving 4,240 scored attempts.
| Benchmark | Questions | Correct | Accuracy | Failures |
|---|---|---|---|---|
| BFCL tool calls | 500 × 3 | 1,292/1,500 | 86.13% | 0 |
| HLE hard QA | 250 × 10 | 375/2,490 | 15.06% | 7 |
| AA-LCR long-doc reasoning | 25 × 10 | 133/250 | 53.20% | 0 |
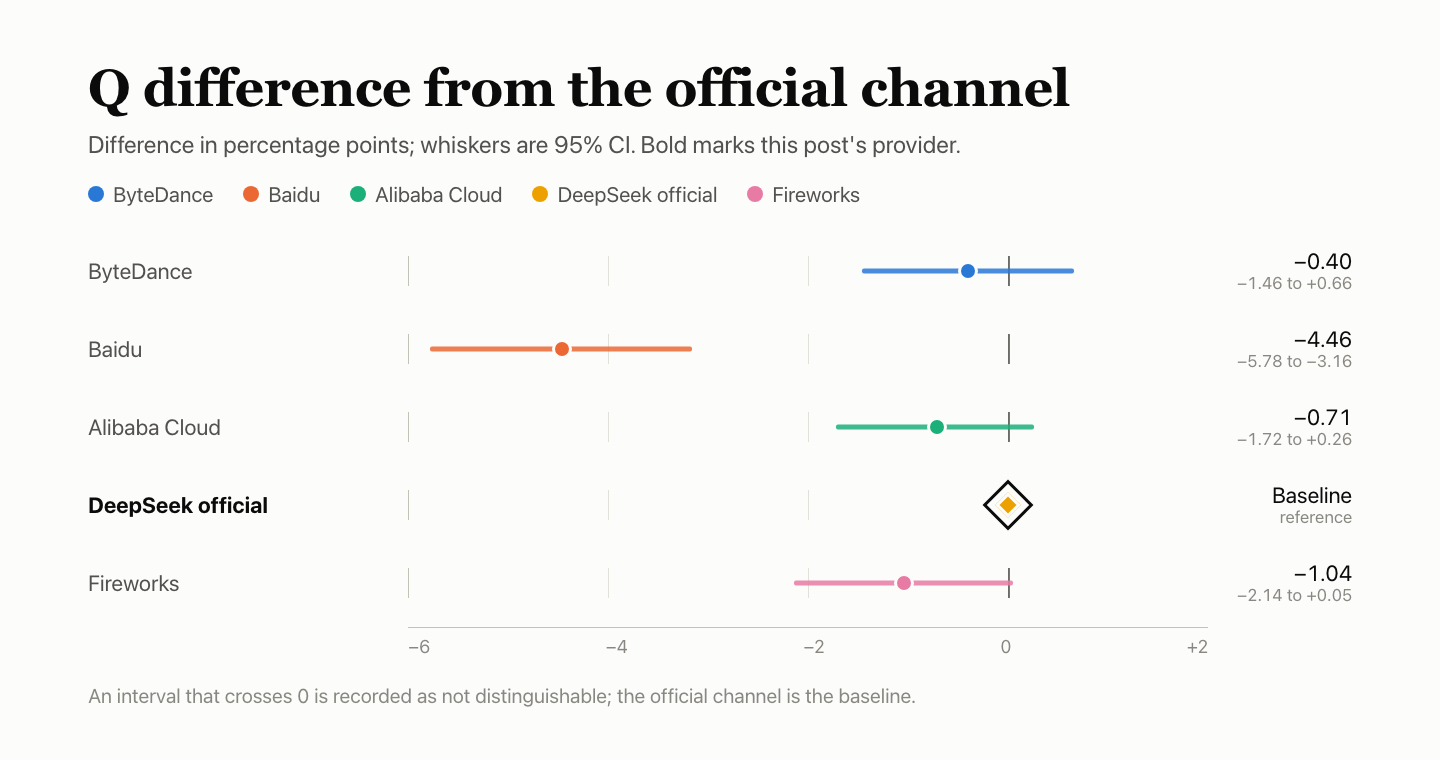
| Total · 95% CI 40.08%–44.73% | 4,240 scored | 1,800/4,240 | 42.45% | 7 |
Service failures — a failed request or a truncated output — stay in the denominator and count as wrong. Here that means seven HLE outputs that reached the max_tokens limit. BFCL is automatically scored; HLE and AA-LCR are judge-scored.
BFCL denominators are three-run totals.
| BFCL category | Passed | Pass rate |
|---|---|---|
| simple_python — one function, correct call and arguments | 334/360 | 92.78% |
| multiple — choose the right one from several functions | 268/300 | 89.33% |
| parallel — call the same function several times in parallel | 271/300 | 90.33% |
| parallel_multiple — call several different functions in parallel | 207/240 | 86.25% |
| irrelevance — no function is relevant, none should be called | 113/150 | 75.33% |
| ahm_multi_turn — three-stage tool chain | 99/150 | 66.00% |
Compared with the other four
Each difference is in percentage points against this baseline, with a 95% interval shown as whiskers; an interval crossing 0 means not distinguishable. The judge belongs to the same DeepSeek family as the model under test and was not calibrated, so HLE and AA-LCR grading may be lenient.
F — function support: 94.00
Function cases test protocol behavior, not answer quality. Sixty cases in six groups ran in each of three windows — 180 checks — judged against the format each provider's documentation specifies. Inapplicable, invalid and unobserved checks leave the denominator. This channel passed 137 of 147 counted checks for a weighted 94.00; the weighted score is not a simple 137/147.
| Group | Weight | Passed | Excluded | Group score |
|---|---|---|---|---|
| Streaming and message protocol | 20% | 27/27 | 3 | 100.00 |
| Tool interface | 20% | 30/30 | — | 100.00 |
| Output constraints and parameters | 20% | 30/30 | — | 100.00 |
| Context and state | 15% | 14/15 | 15 | 93.33 |
| Errors and recovery | 15% | 24/30 | — | 80.00 |
| Metering and cache protocol | 10% | 12/15 | 15 | 80.00 |
| Total · weighted | — | 137/147 | 33 | 94.00 |
The weighted score follows the group weights; it is not passed checks divided by 147.
| Failed case | Windows failed | Reason |
|---|---|---|
| Malformed messages (Errors and recovery) | 3/3 | 400 returned, but the body was empty, with no structured error description |
| Malformed stream_options (Errors and recovery) | 3/3 | 400 returned, but the body was empty, with no structured error description |
| Thinking-token metering (Metering and cache protocol) | 3/3 | No thinking-token count returned |
| Request isolation (Context and state) | 1/3 | The first step did not reply with only STORED as required, so the isolation check could not proceed |
Excluded checks count as neither pass nor fail.
| Status | Case | Count | Reason |
|---|---|---|---|
| Unobserved | Streaming stop sequence | 3 | After the previous step, this step's request was not sent, so it could not be judged |
| Invalid | 10k long input; within context limit; 32k long input; 100k long input; over context; native input count; tool definitions counted in input; input count consistent before and after cache; streaming and non-streaming input consistent | 27 | The test-side pinned native-count template did not match the usage this channel reported, so checks depending on exact counts were declared invalid and excluded from the denominator |
| Not applicable | Explicit cache_control | 3 | Registered in advance as unsupported by this interface |
The 27 invalid checks are the long-input, context-limit, native-count and cache-consistency cases in the list. Because the pinned template did not match this channel's reported usage, every check that depended on an exact count was excluded rather than scored.
Two cases failed on all five providers: malformed messages and malformed stream_options. Both returned a 400 with an empty body, so the client received no structured error description. The shared pattern points more to the AIHubMix gateway layer, which needs a separate investigation. Thinking-token metering also failed on all five, but for different reasons: ByteDance and Fireworks still reported thinking tokens after thinking was turned off, while the other three returned no thinking-token count.
Compared with the other four
P — response speed: 86.14
Each request carried about 10,000 input tokens and asked for about 1,100 output tokens. Three windows each sent 30 requests at single concurrency and 30 at 10-concurrency, 180 in total.
| Metric | Value |
|---|---|
| First-token TTFA | Single concurrency: median 1.87 s (valid-request median 1.72 s). 10-concurrency: median 1.72 s |
| TPOT | Single concurrency: 2.84 ms/token. 10-concurrency: 2.67 ms/token |
| Valid throughput (goodput) | 10-concurrency: 1,546.0 token/s |
| Valid requests | Single concurrency 75/90 (window 1: 15/30); 10-concurrency 90/90. Invalid: 12 × 503 service_unavailable_error, 2 × deadline reached, 1 × read timeout |
| Component scores | TTFA 51.65, TPOT 100.00, throughput 100.00; TTFA and TPOT take the lower of the two tiers, weighted 35% / 35% / 30%; response score 83.08 |
| P composition | Response score 83.08 at 80%, cache K 98.38 at 20%; P 86.14 |
The 15 invalid requests were all in the first single-concurrency window: 12 returned 503, 2 reached the deadline and 1 hit a read timeout. Invalid requests are counted at infinity, so the reported median is 1.87 s. With valid requests only, the median is 1.72 s. At 10-concurrency the median is also 1.72 s. TPOT is 2.84 ms/token at single concurrency and 2.67 ms/token at 10-concurrency.
Compared with the other four
Five providers shared one Mac mini, network and account. The three windows were scheduled provider by provider, so collection periods do not fully overlap; small gaps should not be over-read.
K — cache: 98.38
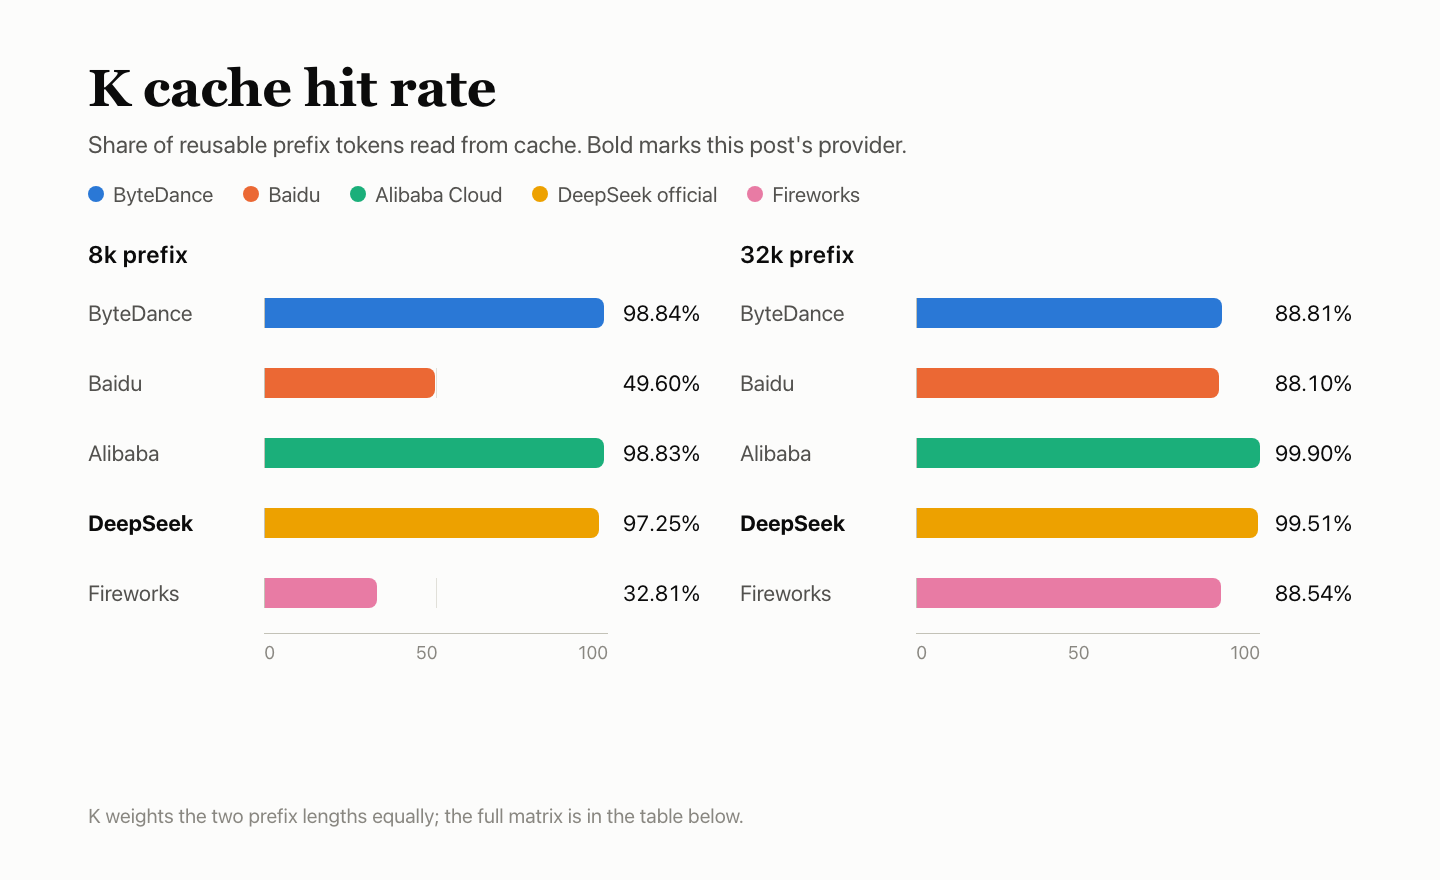
Each group sends five requests. The first seeds a fixed 8k or 32k prefix. Requests two to four keep the prefix and change only the final question, at 5, 30 and 120 seconds. The fifth uses a new prefix as a cold control. Three windows × two lengths give 30 requests. K divides cache tokens read on hot requests by the tokens that should be reusable, with each length accounting for half; K is 20% of P. DeepSeek's API documentation covers context caching.
| Prefix | Window | Seed | +5 s | +30 s | +120 s | Cold control |
|---|---|---|---|---|---|---|
| 8k | Window 1 | 0 | 7,808 | 7,808 | 7,808 | 0 |
| 8k | Window 2 | 0 | 7,808 | 7,808 | 7,808 | 0 |
| 8k | Window 3 | 0 | 7,808 | 7,808 | 7,808 | 0 |
| 32k | Window 1 | 0 | 31,872 | 31,872 | 31,872 | 0 |
| 32k | Window 2 | 0 | 31,872 | 31,872 | 31,872 | 0 |
| 32k | Window 3 | 0 | 31,872 | 31,872 | 31,872 | 0 |
8k hot requests hit 9 of 9 and read 7,808 tokens each: 70,272 read against 72,261 reusable, 97.25. 32k hot requests hit 9 of 9 and read 31,872 each: 286,848 against 288,270, 99.51. Cold controls read no cache. K is 98.38 across the two lengths.
Compared with the other four
R — service stability: 100
300 requests cover short text, 10k long input, tool calls and multi-turn history, sent at single concurrency across three windows. Only first-attempt validity and completeness are checked — not answer correctness — and there are no retries. Failures in answer quality and speed are counted in Q and P, not again in R.
| Request type | First-attempt success |
|---|---|
| Short text | 120/120 |
| 10k long input | 90/90 |
| Tool calls | 60/60 |
| Multi-turn history | 30/30 |
| Total · 95% CI 98.78%–100% | 300/300 |
All 300 requests returned a valid, complete response on the first attempt. R 100 covers only these 300 dedicated requests; it does not mean the whole path had no failures. With 300 successes, the 95% interval's lower bound is 98.78%, so the evidence is that the failure rate is likely below 1.22%.
Compared with the other four
R covers only the 300 dedicated requests; failures in answer quality and speed are recorded in Q and P, not counted again in R.
| Provider | First-attempt success | 95% CI |
|---|---|---|
| ByteDance | 300/300 | 98.78%–100% |
| Baidu | 300/300 | 98.78%–100% |
| Alibaba Cloud | 300/300 | 98.78%–100% |
| DeepSeek official | 300/300 | 98.78%–100% |
| Fireworks | 300/300 | 98.78%–100% |
FAQ
Is this a direct connection to DeepSeek's API?
No. The requests go through AIHubMix's DeepSeek official supplier route; they are not sent directly to DeepSeek's API.
Why is the DeepSeek official channel the Q baseline?
It is DeepSeek's official channel for the same model, so the other four providers' answer-quality results are expressed as differences from it. The baseline role does not imply an answer-quality ranking.
What happened in the first single-concurrency speed window?
Fifteen of 30 requests were invalid: 12 returned 503, 2 reached the deadline and 1 hit a read timeout. They are counted at infinity, so the median is 1.87 s; with valid requests only it is 1.72 s.
What are the 27 invalid function checks?
They depend on exact token counts: long inputs, context limits, native input counts and cache input consistency. The test-side pinned native-count template did not match the usage this channel reported, so the checks were excluded from the denominator rather than scored as failures.
Why does R 100 not guarantee the route is failure-free?
R covers only the 300 dedicated stability requests. Failures during answer-quality and speed runs are recorded in Q and P. With 300 of 300 successful, the 95% interval's lower bound is 98.78%, so the failure rate is likely below 1.22%, not proven to be zero.
How does the cache test separate hot reads from cold?
Each group seeds an 8k or 32k prefix, repeats the prefix at 5, 30 and 120 seconds with a new final question, then sends a new prefix as a cold control. Both lengths hit 9 of 9 hot requests, and every cold control read zero cached tokens.
Keep reading: the DeepSeek V4.1 Flash series
- ByteDance's Q is within 0.40 points of this baseline, while its function-support and cache results differ: DeepSeek V4.1 Flash on ByteDance: tool calls match, metering doesn't.
- Baidu lost requests to
no_available_channel, which shows up in both Q and P: DeepSeek V4.1 Flash on Baidu: no available channel hits Q and P. - Alibaba Cloud differs by 0.37 overall and is not distinguishable: DeepSeek V4.1 Flash on Alibaba Cloud: 1.34s first token, 99.37 cache.
- Fireworks hit 3 of 9 on 8k hot requests, against 9 of 9 here: DeepSeek V4.1 Flash on Fireworks: empty stop replies, 3/9 cache hits.